Excel Dashboards Course South Africa
Excel Dashboard Course South Africa, this two-day Excel Dashboard Course equips professionals with the practical skills needed to design, build, and present clear, interactive dashboards for management reporting and decision-making. Delegates learn how to transform raw data into meaningful visual insights using proven Excel dashboarding techniques suitable for real workplace scenarios.
This comprehensive Excel Dashboard Course builds on the grounding learned in the Excel Basics, Intermediate Excel, and Advanced Excel courses. On completion, delegates will be among the top Excel users in Southern Africa.
This is an intensive two-day course, 09h00 to 15h30, designed to help delegates create sophisticated, dynamic Excel dashboards and master the advanced formulas required for workplace reporting.
These skills are frequently supported by practical AI training for employees, including structured training with ChatGPT in the workplace.
Who Should Attend This Dashboard Reporting Course?
This practical dashboard reporting course is ideal for managers, analysts, accountants, finance teams, HR professionals, project managers, administrators and business professionals responsible for reporting information to management.
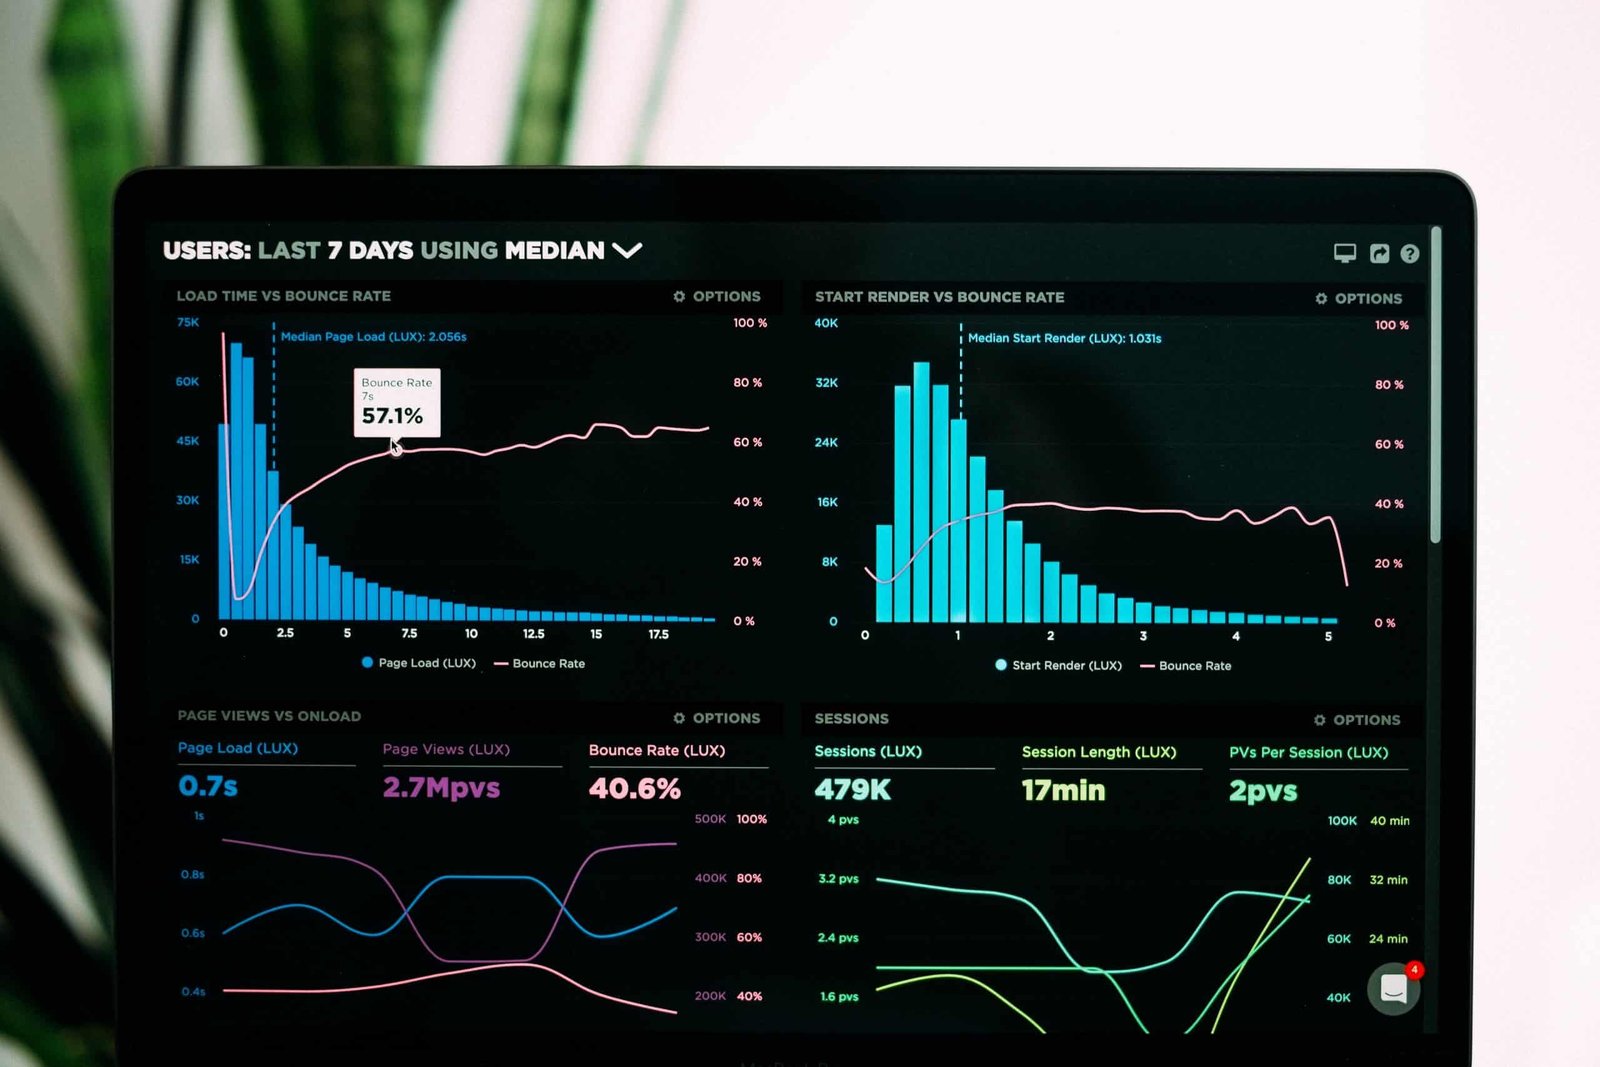
Many organisations collect large volumes of data but struggle to present information in a format that supports fast decision-making. Delegates learn how to convert raw spreadsheet data into meaningful reports, visual summaries and KPI dashboards that help management identify trends, opportunities and potential risks.
The techniques taught during the course can be applied across finance, operations, sales, project management, human resources and executive reporting environments.
Real Workplace Applications of Excel Dashboards South Africa
Excel dashboards are widely used to monitor key performance indicators, analyse departmental performance and improve reporting efficiency. Delegates learn practical techniques that can immediately be applied in the workplace.
- Sales performance dashboards
- Financial reporting dashboards
- Project status reporting
- Human resources reporting
- Operations and production reporting
- Customer service performance tracking
- Management KPI reporting
- Executive summary dashboards
Throughout the course, delegates build practical reporting solutions that can be adapted to their own organisational requirements.
How Excel Dashboards Are Used in Real Businesses
Many organisations collect large amounts of information but struggle to convert data into meaningful business insights. Excel dashboards help management quickly identify trends, monitor performance and make informed decisions.
Instead of manually reviewing multiple worksheets and reports, decision-makers can view key information from a single dashboard. This improves reporting efficiency and helps organisations react more quickly to changing business conditions.
Finance and Accounting Dashboards
Finance teams use dashboards to monitor budgets, expenses, profitability, cash flow and financial performance. Dashboards can highlight variances, track monthly results and provide management with a clear overview of business performance.
Sales and Marketing Dashboards
Sales managers use dashboards to monitor revenue, sales targets, conversion rates, customer acquisition and product performance. Interactive reporting helps managers identify opportunities and areas requiring attention.
Human Resources Dashboards
HR professionals use dashboards to analyse employee turnover, absenteeism, training records, recruitment activity and workforce trends. Dashboards simplify reporting and improve visibility across the organisation.
Project Management Dashboards
Project managers use dashboard reporting to monitor budgets, deadlines, resource utilisation and project progress. Visual reporting helps stakeholders quickly understand project status and potential risks.
Operations and Production Dashboards
Operations teams use dashboards to monitor production targets, quality metrics, inventory levels, service delivery and operational performance. Real-time reporting improves visibility and supports better decision-making.
Why Dashboard Skills Matter in the AI Era
Tools such as ChatGPT and Microsoft Copilot can assist with formulas, report creation and data analysis. However, organisations still need employees who understand how to structure data, validate results and present information accurately.
AI can suggest formulas and reporting approaches, but it cannot take responsibility for business decisions. Professionals with strong dashboard skills are better equipped to verify information, identify anomalies and communicate insights to management.
The combination of Excel dashboard expertise and AI productivity tools is becoming increasingly valuable for finance teams, managers, analysts and business professionals responsible for reporting and decision-making.
Excel Dashboards Course South Africa and Artificial Intelligence
Many organisations are now using tools such as ChatGPT and Microsoft Copilot to assist with reporting, data analysis and productivity. While AI can help generate formulas, explain functions and suggest reporting approaches, organisations still require employees who understand how to validate data and interpret results correctly.
One of the most important lessons in modern reporting is that AI can assist with creating reports, but responsibility for accuracy remains with the user. Strong dashboard skills help professionals verify information, identify anomalies and communicate insights with confidence.
At College Africa Group, we increasingly see organisations combining dashboard reporting skills with AI productivity tools to improve efficiency while maintaining reporting accuracy and business accountability.
Why Attend This Excel Dashboard Course?
This Excel Dashboard course teaches delegates how to build practical dashboards for management reporting, data analysis, and business decision-making. Delegates learn how to create and manage worksheets, insert charts, design interactive dashboard reports, and present information clearly.
Excel Dashboard Course – Table of Contents
Download the full course outline PDF
Excel Dashboard Reporting Functions
Delegates are exposed to practical Excel functions used to create visually appealing and dynamic dashboard reports, including SUMPRODUCT, EOMONTH, IF, IFERROR, INDEX, MATCH, conditional formatting, dropdowns, sparklines, and dashboard design tools.
Sharpen Your Skills in Dashboard Reporting
With College Africa Group’s Dashboard Reporting training, delegates learn how to create robust, interactive, and visually effective dashboards. The course also covers advanced formulas, automation techniques, and data visualisation methods used in real business environments.
Johannesburg, Cape Town, and Durban dates are available on request. Onsite training dates are flexible. Minimum delegate numbers and T&Cs apply.
- AI in the Workplace Training
- ChatGPT for Business Course South Africa
- Microsoft Copilot Training South Africa
- AI and Data Analytics Course
- Corporate AI Training South Africa
FAQs: Excel Dashboard Course
Where do you provide Excel Dashboard training?
College Africa Group provides onsite and virtual Excel Dashboard training throughout South Africa including Johannesburg, Pretoria, Durban, Cape Town and Gqeberha, as well as selected Southern African countries.
What topics does the Excel Dashboard course cover?
The course covers dashboard creation, visual reporting, interactive reports, formulas, charts, data analysis, and dashboard design.
What type of Dashboard training is offered?
The course can be presented onsite or virtually via Zoom or Microsoft Teams. It is instructor-led, and questions are encouraged.
What skills will I learn?
Delegates learn how to create Excel dashboards, use charts, work with data, apply formulas, build reports, and present information visually.
Is there a virtual instructor-led option?
Yes. College Africa Group offers virtual instructor-led Excel Dashboard training for corporate groups.
Is there a discount for multiple employees?
Yes. Group discounts are available for companies booking multiple delegates.
How long is the Excel Dashboard course?
The course is usually presented over two days, from 09h00 to approximately 15h30 each day.
What are the requirements?
Delegates should ideally have attended an Advanced Excel course or have equivalent practical Excel experience.
Does the course cover advanced topics?
Yes. The course covers both practical and advanced Excel features required to create dynamic, professional dashboard reports.
How do I book?
Contact Arnold on +27 (0) 83 778 4903 or email sales@collegeafricagroup.com for dates, pricing, and availability.
This course prepares delegates for more advanced Excel reporting, dashboard, automation, and data analysis tasks. Delegates receive a manual and an electronic attendance certificate on completion.
We run training on demand where possible to accommodate client work schedules. Onsite and offsite training are available. Group discounts apply.
View our Excel video tips on YouTube.
Useful Excel resources:
ExcelTips Daily Nuggets
Chandoo
Ablebits
Excel
Excel Guru
MS Office