How to create a Sparkline in Excel – So Simple 2022

2 minute read & 1-minute video How to create a Sparkline in Excel – So Simple 2022
How to create a Sparkline in Excel – So Simple 2022
Table of Contents
A Sparkline chart is a good choice for summarizing data within a row of a table. They typically will be placed in the same row, to the right of the data.
Want to know how to create a Sparkline in Excel?
It’s so simple that anyone can do it.
We all know a picture is worth 1,000 words—and there’s no better way to bring your data to life than with an easy-to-use Excel Sparkline.
If you’re not using Sparklines in your reports and presentations, you’re missing out on a simple way to make your data more dynamic, interesting, and persuasive.
But don’t worry—if you’ve never used them before, this guide will take you through the process step by step, so you can add sparkle to your spreadsheets ASAP.
Watch this video How to create a Sparkline in Excel – So Simple 2022
With Sparkline charts, you can easily see trends in your data at a glance.
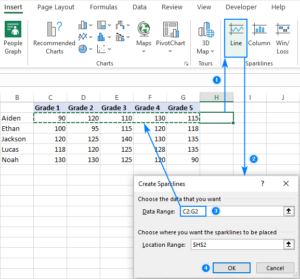
Below are the steps to create a Sparkline in Excel:
- The first step is to click the cell where you want to insert the sparkline.
- Then select the Insert tab, and from the Sparkline group, click to select Line option.
- A dialog box appears that asks you to Select Data Range, which contains data points of your chart.
- Now specify your data range in the box given on that dialog box and press Enter.
- THAT IS IT
- The contextual menu allows for Formatting and other options
That’s it! This is your sparkline. You have learned how to create a Sparkline in Excel – So Simple 2022
You can have multiple sparklines in a single sheet and you can use them to create a visualization of your data. Sparklines are great for quick analysis of your data, and they are easy to implement in Excel.
FAQs How to create a Sparkline in Excel – So Simple 2022
- Can I change the Sparkline Chart Type?
- Yes, select any of the three Sparkline types.
- Can you customize sparklines in Excel?
- After you create sparklines, you can change their type, style, and format at any time.
- Select the sparklines you want to customize to show the Sparkline Tools on the ribbon.
- Did you know that you can copy a Sparkline Chart?
- Grab the square on the right-hand side of the cell and drag it down!!!! Amazing
- How do I Clear a Sparkline chart?
- Select the Clear command for the contextual menu.
- Is the Excel Sparkline for Mac?
- Yes, Insert tab – So with F1 selected, I’ll click the Insert tab on the ribbon and then go to about the middle of the tab, click Sparklines and then click Line. Doing so displays the insert sparklines button.
Now we have seen how easily one can add a sparkline in an excel sheet and make it more attractive with the new sparklines feature added in Excel 2010 and newer versions. You can easily create a Sparkline in your Excel sheet.
It takes just a few steps to add sparklines that summarize your data, visually and succinctly.
Read more if you still need convincing about Excel in the Workplace. Creating sparklines in Excel is simple So Simple 2022
Improved Reporting With Sparklines in Excel
If you’re not using Sparklines in your reports and presentations, you’re should be as it makes your data more interesting and readable.
On-Demand updating with Excel Macro Sparklines
Create a Macro to automate the updating of the Sparkline Chart or ask us, we provide consultancy services.
We are flexible where possible as we want lifelong happy clients.
Why aren’t you Addicted to Excel Macro Automation In The Workplace
Credit to Microsoft for some of the details (c) Microsoft Support
I look forward to any comments regarding Excel Sparkline Charts and whether your company has considered Excel Sparkline Charts In The Workplace. Arnold email
PressPortal press release link
Learn More About Workshop Sessions
Link Excel Macro Consultancy – MS Office – MS Excel – Excel Guru -MS Project – Softskills – Accredited Project Management
